| .. | ||
| docs/images | ||
| flows.json | ||
| README.md | ||
Node-RED
If you boot up our tech stack using docker-compose you already have a Node-RED instance running onyour local machine.
first steps
For debuging shell into your Docker container and install the Node-RED Dashboard (we will switch to Grafana, soon):
npm install node-red-dashboard
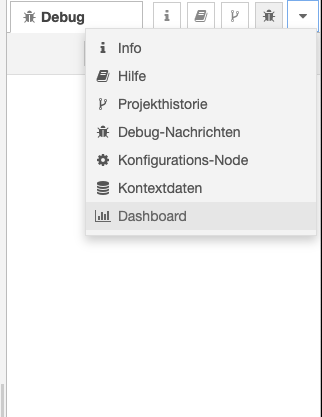
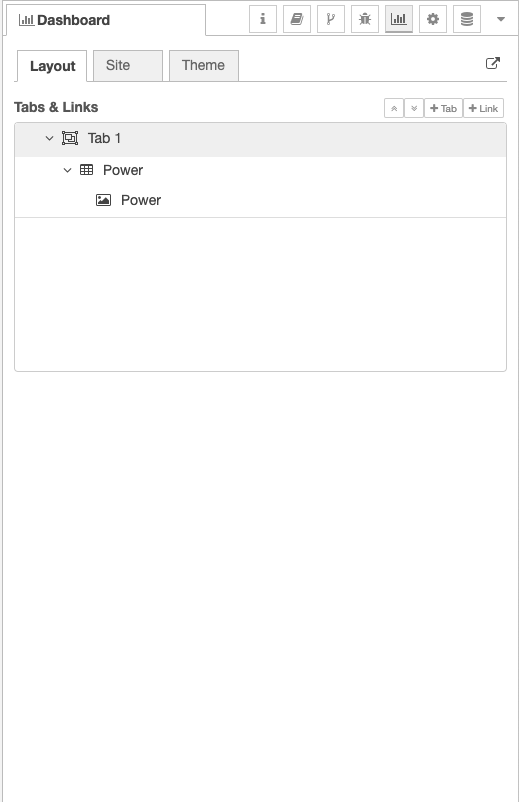
Then the dashboard should be visible on the righmost menu item in Node-RED.
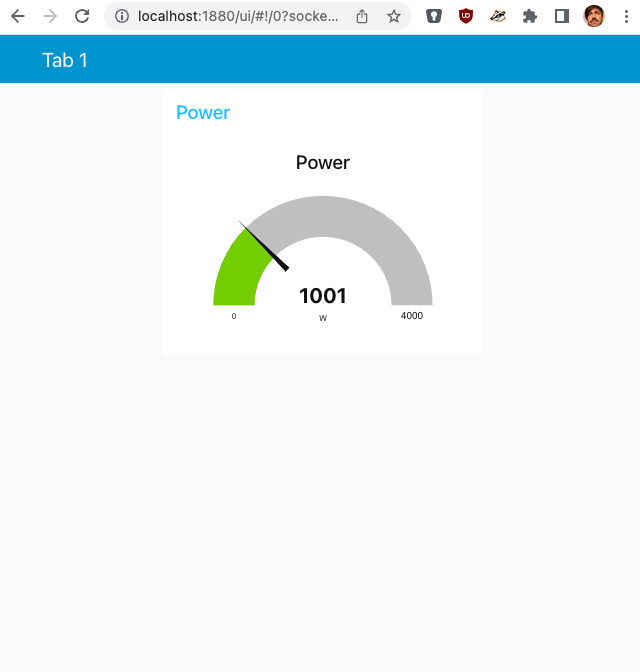
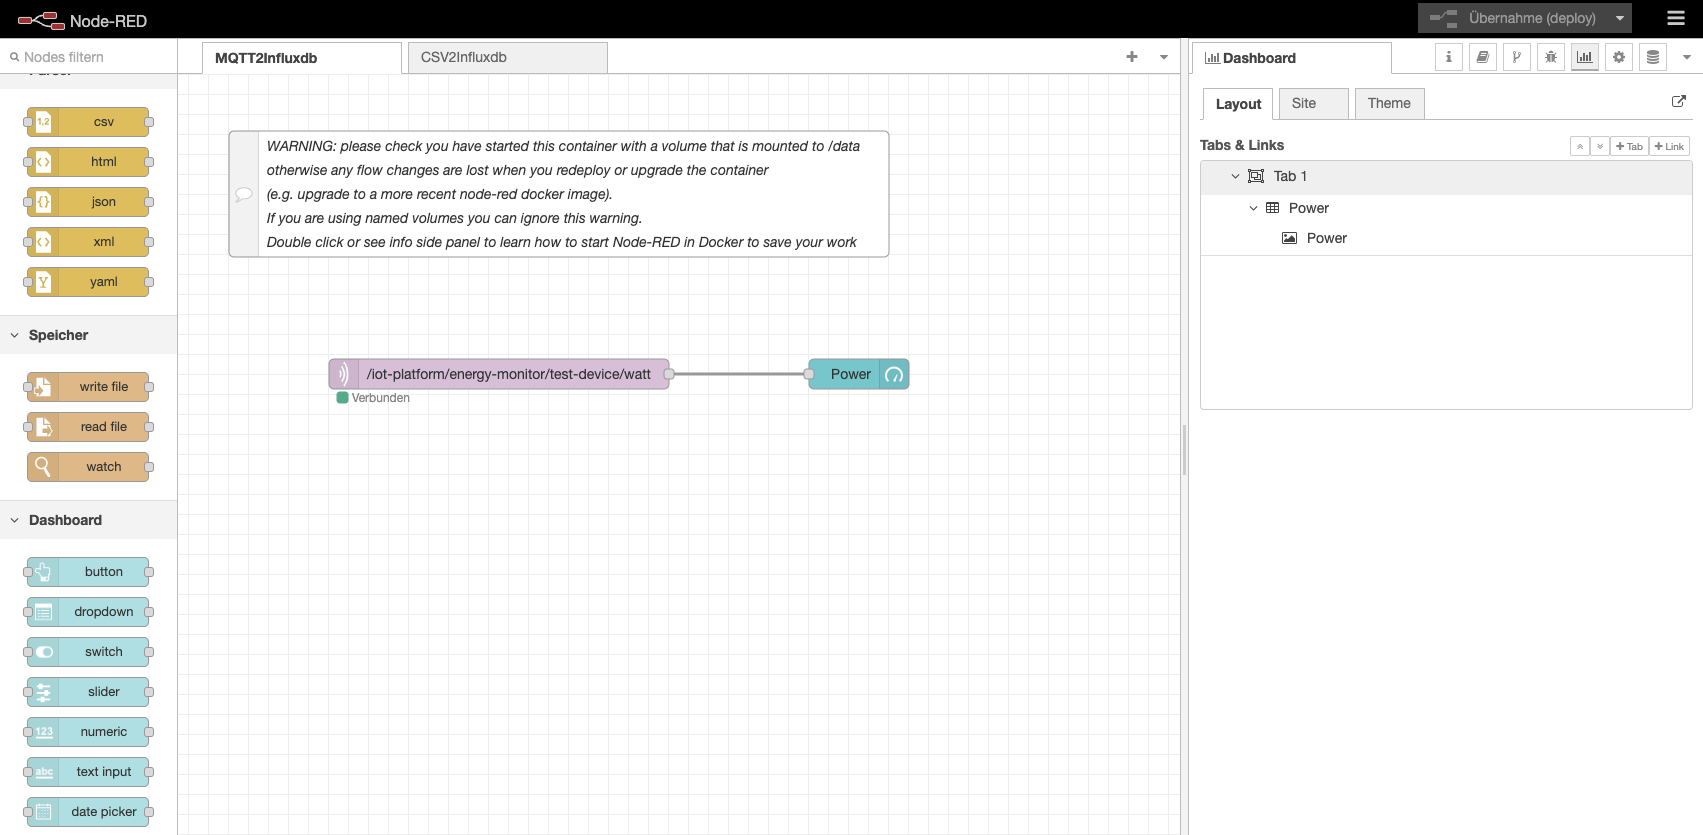
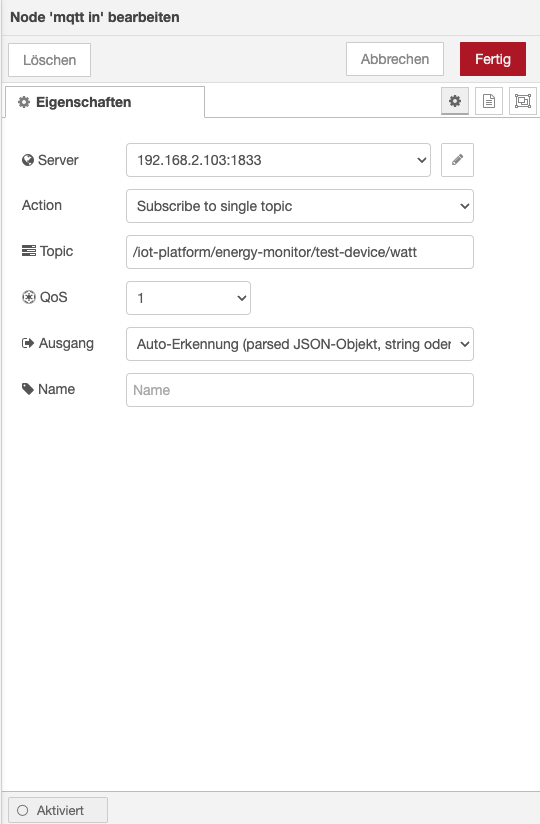
Then you can add a MQQT node to receive values from the power monitor, hook it up to a gauge and display it in a dasboard.
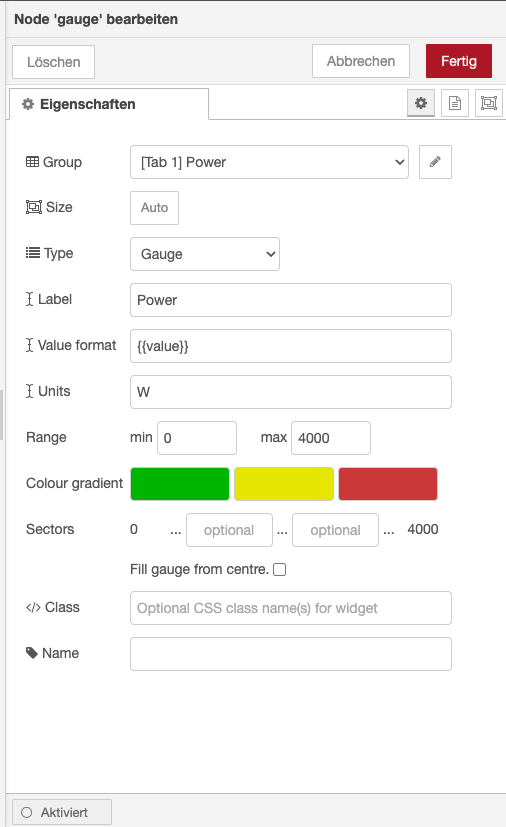
The dashboard looks like that.