| .. | ||
| .npm | ||
| 00-dashboard-example | ||
| docs/images | ||
| node_modules | ||
| .config.nodes.json | ||
| .config.nodes.json.backup | ||
| .config.projects.json | ||
| .config.runtime.json | ||
| .config.users.json | ||
| .config.users.json.backup | ||
| .flows.json.backup | ||
| flows.json | ||
| flows_cred.json | ||
| package-lock.json | ||
| package.json | ||
| README.md | ||
| settings.js | ||
Node-RED
If you boot up our tech stack using docker-compose you already have a Node-RED instance running on your local machine.
First steps
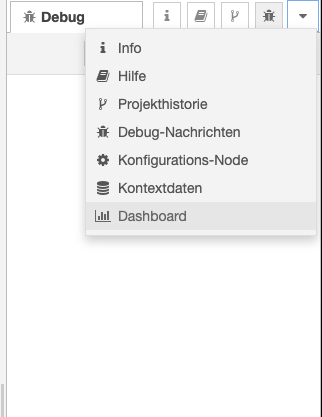
For debuging I allready Node-RED's own dashboard (sure, we are going to use Grafana, later).
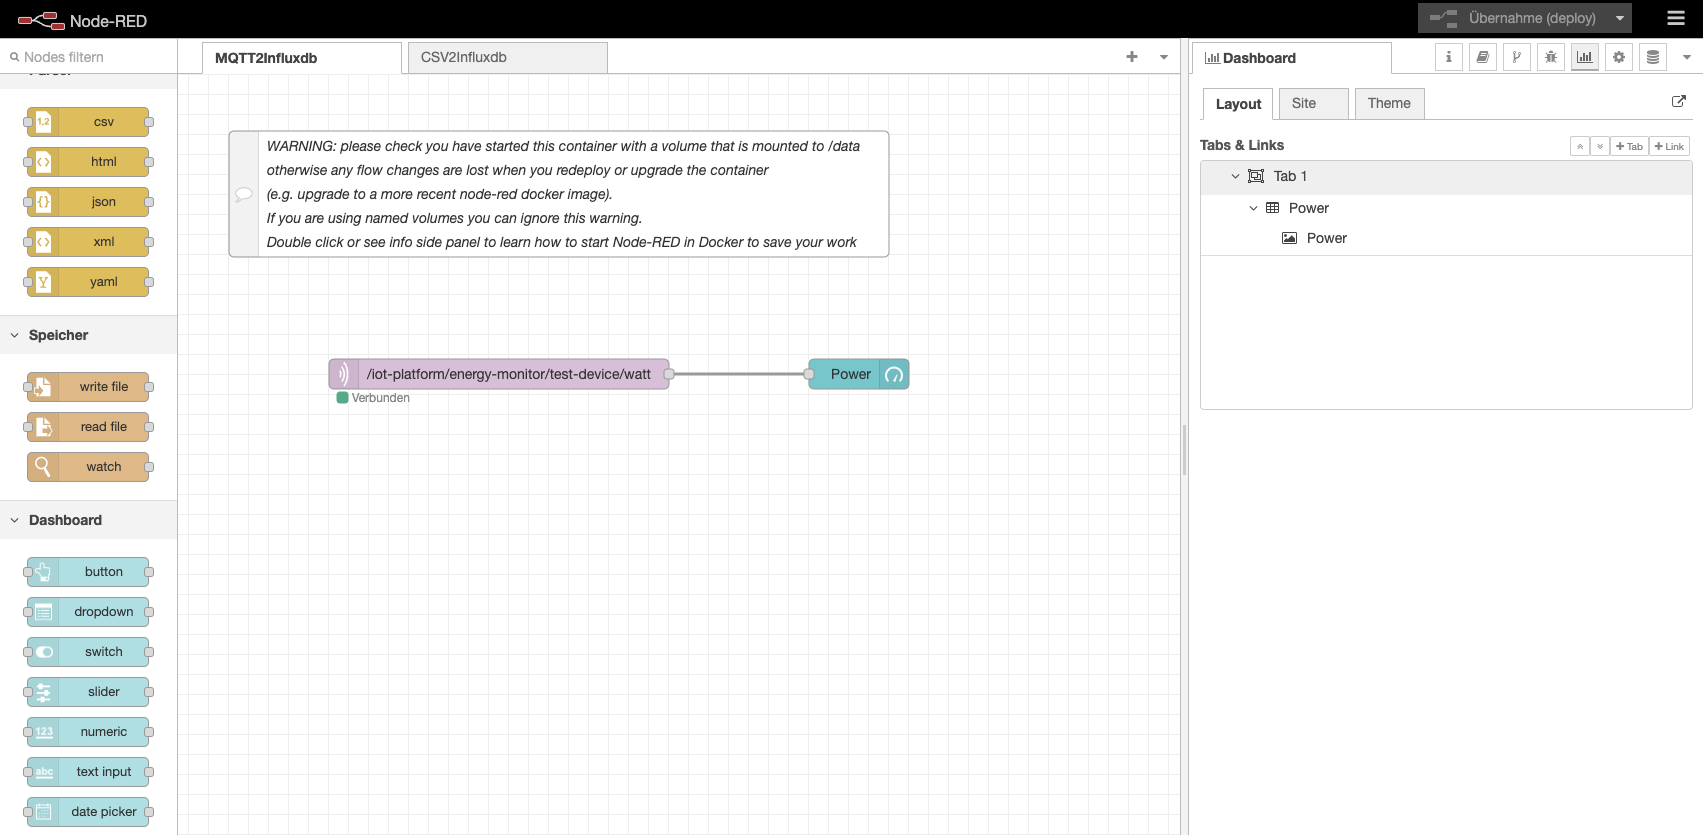
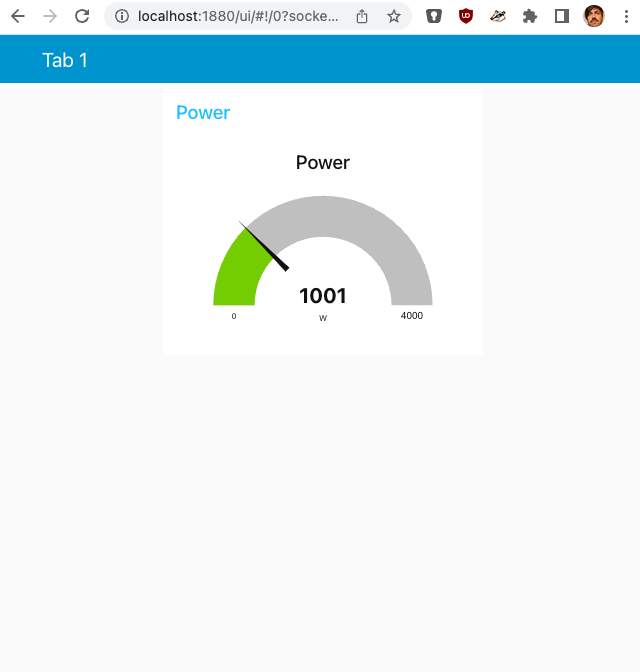
The dashboard should be visible on the righmost menu item in Node-RED.
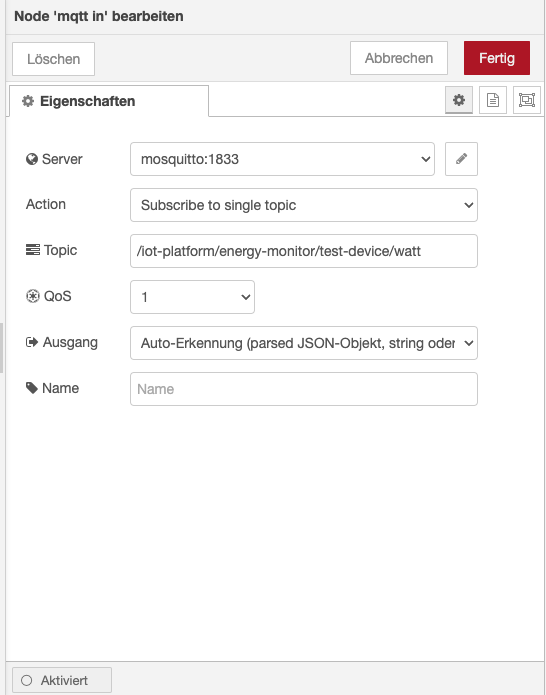
In Node-RED you can add a MQQT node to receive values from the power monitor. As we run in docker-composeyou don't have to use the IP address of our Eclipse Mosquitto sever, but you can simplay use mosquitto as the host nome.
To simply display the values in a gauge (or chart) you can hook it up to a gauge node.
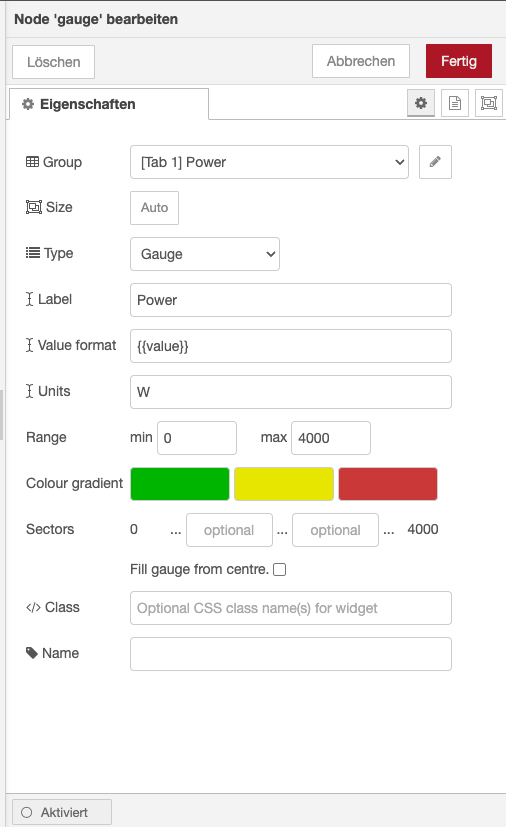
In the dasboard section you have to create a tab. Inside this tab you have to create a group.
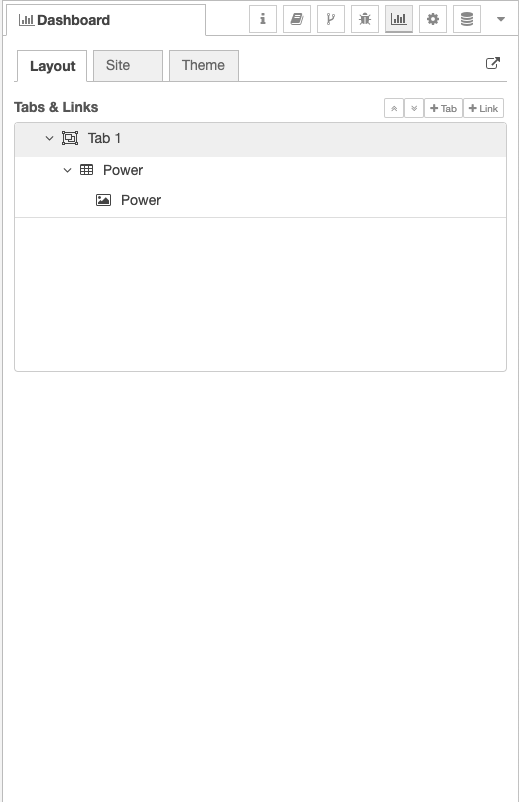
The tricky part is putting the gauges in the group. This is done in the gauge's settings (not in the dashboard's settings).
You can view the dashboard in an (also mobile) web browser.
Have a look at the flow also in this repository.