forked from curious.bio/iot-backend
1.1 KiB
1.1 KiB
Grafana
Grafana is amn open source analytics and interactive visualization toll. It provides charts, graphs, and alerts for the web when connected to supported data sources.
As a visualization tool, Grafana is a popular component in monitoring stacks, often used in combination with time series databases such as InfluxDB.
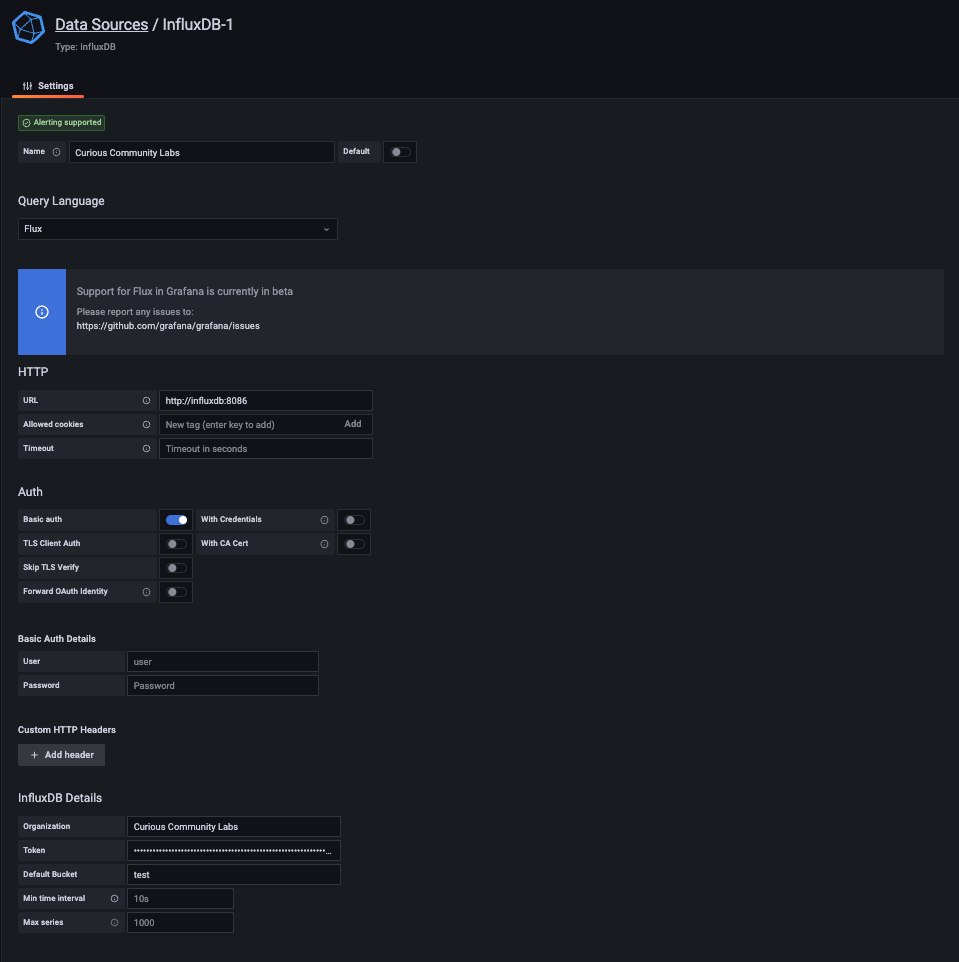
Connection
To connect Grafana to our Influx-DB, you have to create a tokenin Influx-DB.

You can use this token to create a connection from Grafana to Influx-DB.
After having a connection to a database you can easily create an own dashboard in Grafana.
Here's the demo snippet (directly copyied from Influx Data Explorer) and the screen shot
from(bucket: "test")
  |> range(start: v.timeRangeStart, stop: v.timeRangeStop)
  |> filter(fn: (r) => r["_measurement"] == "msg")
  |> filter(fn: (r) => r["_field"] == "value")
  |> aggregateWindow(every: v.windowPeriod, fn: mean, createEmpty: false)
  |> yield(name: "mean")
