3.0 KiB
Node-RED
If you boot up our tech stack using docker-compose you already have a Node-RED instance running on your local machine.
Node-RED is an open-source, low-code, visual programming tool based on the concept of flow-based development. The idea behind it is to make it very easy to connect APIs, hardware devices, and anything else accessible over some type of network connection.
Core Concepts
Nodes are the important part of Node-Red. They are the building blocks when working with Node-Red. Nodes are triggered by either receiving a message object from a previous node or an external event like an MQTT event. The node processes the message or event and then passes it on to the next node.
A node can:
- Inject: Starts a flow by injecting a message or a payload.
- Change: Here you can do basic transformation or modification on the message object.
- Debug: Can be used to help developing flows by sending messages to the side bar.
- Switch: Here you can add logic (like sending the message to different nodes).
- Function: Add custom JavaScript for uses cases where simple nodes do not do the trick.
Flows are an organized sequence of nodes. Let's do the "first steps" by creating a simple flow.
Plugins
Node-RED uses plugins. You can access the plugins in the right burger menu. We already added plugins for InfluxDB, an aggregator/tranformer from watt to kwh and capabilites for Node-RED's own Dashboard capabilites, so you don't have to add them.
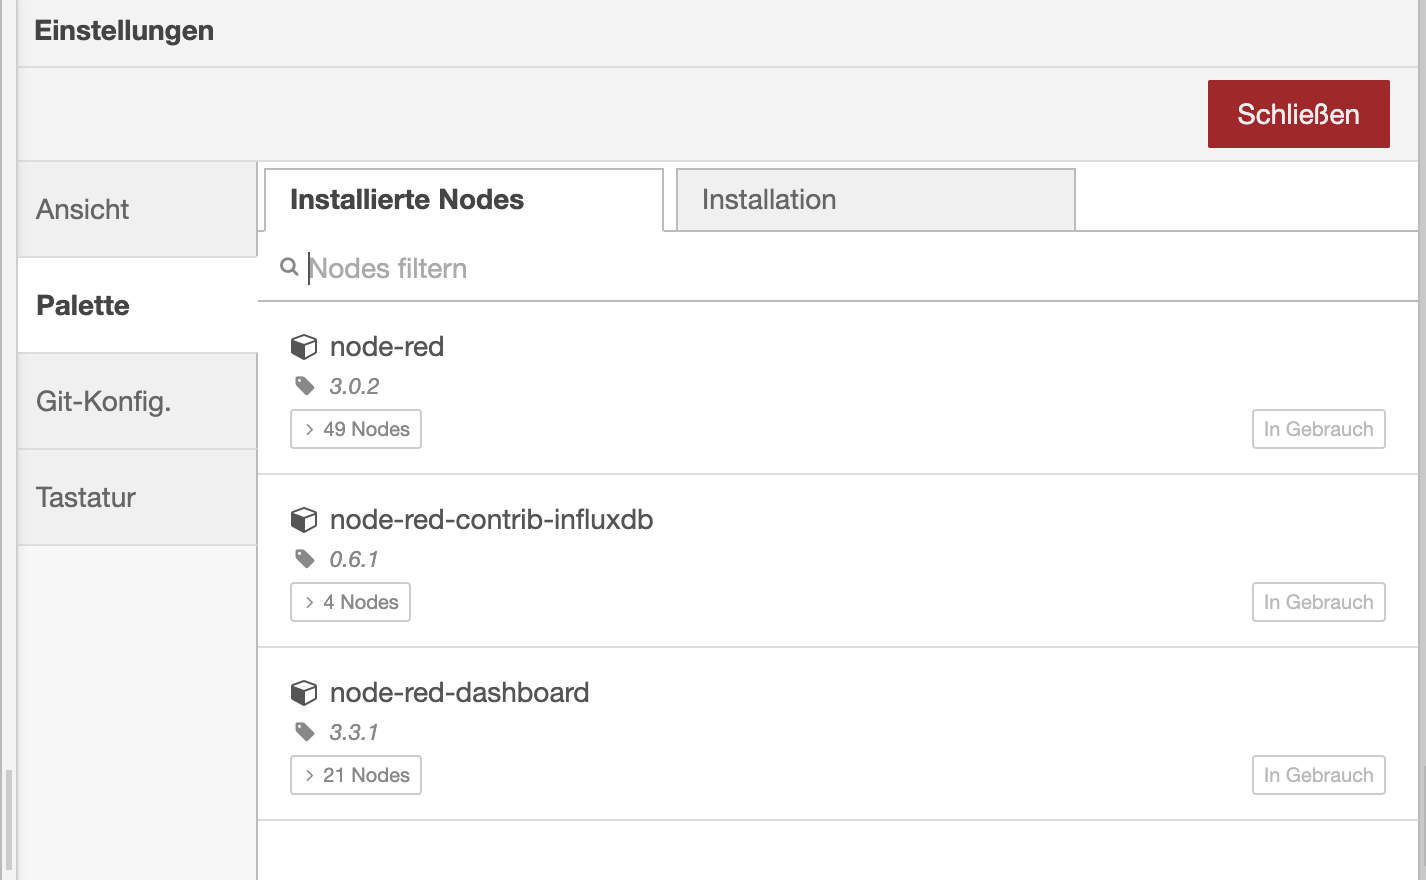
Of course you can install more plugins in this section, but it's better, to add them to package.json and build a new Docker image using the Dockerfile provided in this project.
First steps
For debuging you can add Node-RED's own dashboard (sure, we are going to use Grafana, later).

The dashboard should be visible on the righmost menu item in Node-RED.

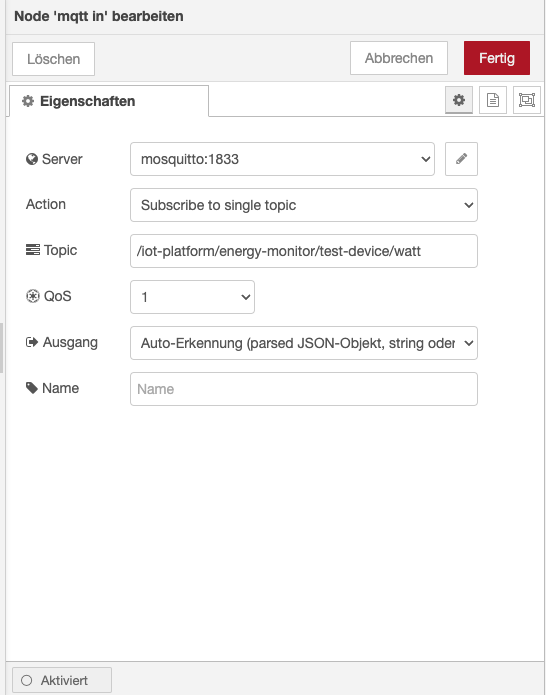
In Node-RED you can add a MQQT node to receive values from the power monitor. As we run in docker-composeyou don't have to use the IP address of our Eclipse Mosquitto sever, but you can simply use mosquitto as the host nome.
 git a
git a
To simply display the values in a gauge (or chart) you can hook it up to a gauge node.

In the dasboard section you have to create a tab. Inside this tab you have to create a group.
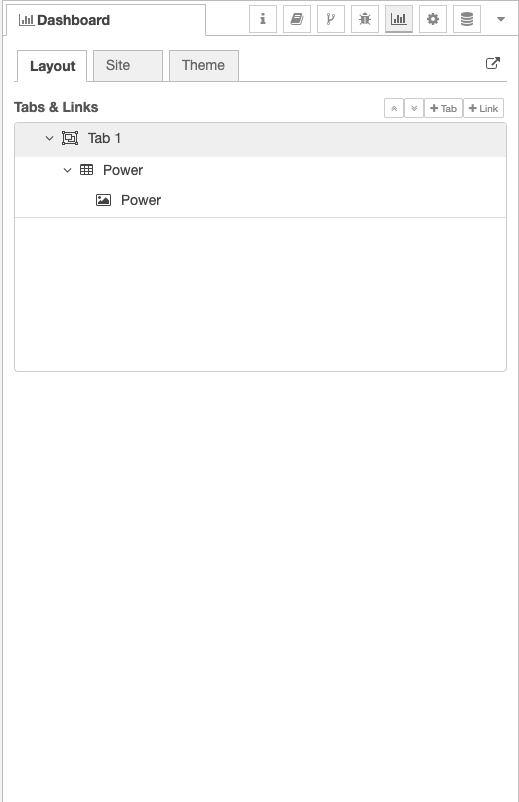
The tricky part is putting the gauges in the group. This is done in the gauge's settings (not in the dashboard's settings).
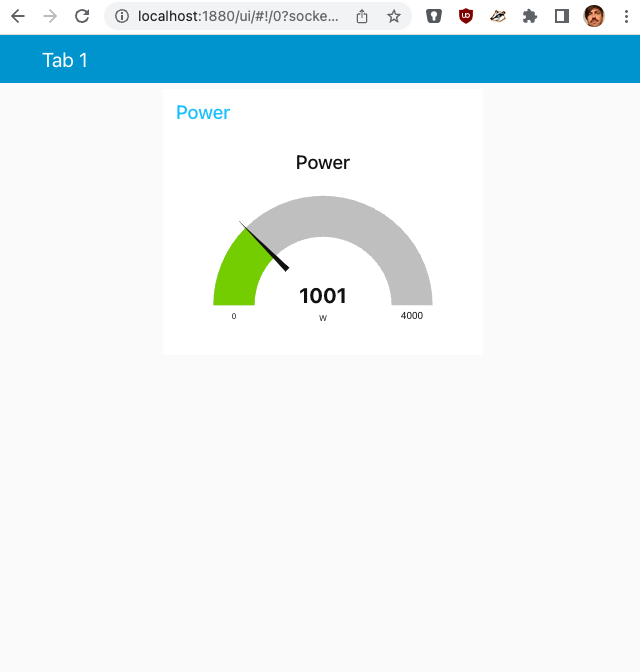
You can view the dashboard in an (also mobile) web browser.
Have a look at the flow also in this repository.
You can also connect to InfluxDB.