6.2 KiB
| marp | title | description | author | class | paginate |
|---|---|---|---|---|---|
| true | IoT & Dashboard Workshop | Including examples Sensors for Energy Management | Oliver Ochs, Sebastian Wendel | invert | true |
IoT & Dashboard Workshop
Matrix Chat
To exchange information digitally during and after the workshop we use Matrix as a chat solution. You don't know this yet? Don't be hesitant and join us!
https://matrix.to/#/#iot-platform:curious.bio

Fab City Dashboard
This is a prototype of data management platform for Fab City Hamburg based on existing open source solutions.

Features
- Eclipse Mosquitto: MQTT broker
- Node-RED: Flow-based development tool for visual programming and data flow automation
- InfluxDB: High-performance data storage
- Grafana: Real-time data visualization and monitoring dashboard
Today's Goal
- install the stack
- configure one or two data sources
- transform data and store them in a database
- visualize data stored in the database
Architecture
-
Data is collected by IoT devices, e.g. an ESP32 based power monitor. These devices publish their data via MQTT into a topic in a message broker. We use Eclipse Mosquitto as a MQTT message broker.
-
Node-RED is used to read and transform or combine data and to implement more sophicsticated use cases like notifications or worksflow. Node-RED subscribes to topics in Mosquitto and can be used to save transformed data into a database.
-
As our data is bases on time, we are using a time series database to store information. We used InfluxDB as this database.
-
Dashboards can already be created in Node-RED, but to be more flexible (and include more options) we are using Grafana. Grafana reads data from our database and other sources (like CSV files on the Internet) and displays them in a nice dashboard.
Sensor level: Physical acquisition of measured values
Sensors can be build or bought:
-
Sensor head
- ESP32 or equivalent
- OpenHardware or COTS (commercially of the self)
- Analog/Digital acquisition
- Communication gateway via WLAN / MQTT
-
Examples measurements
- Energy measurement
- Temperature sensor -> temperature measurement
- Pulse sensor -> incremental measurement of filament
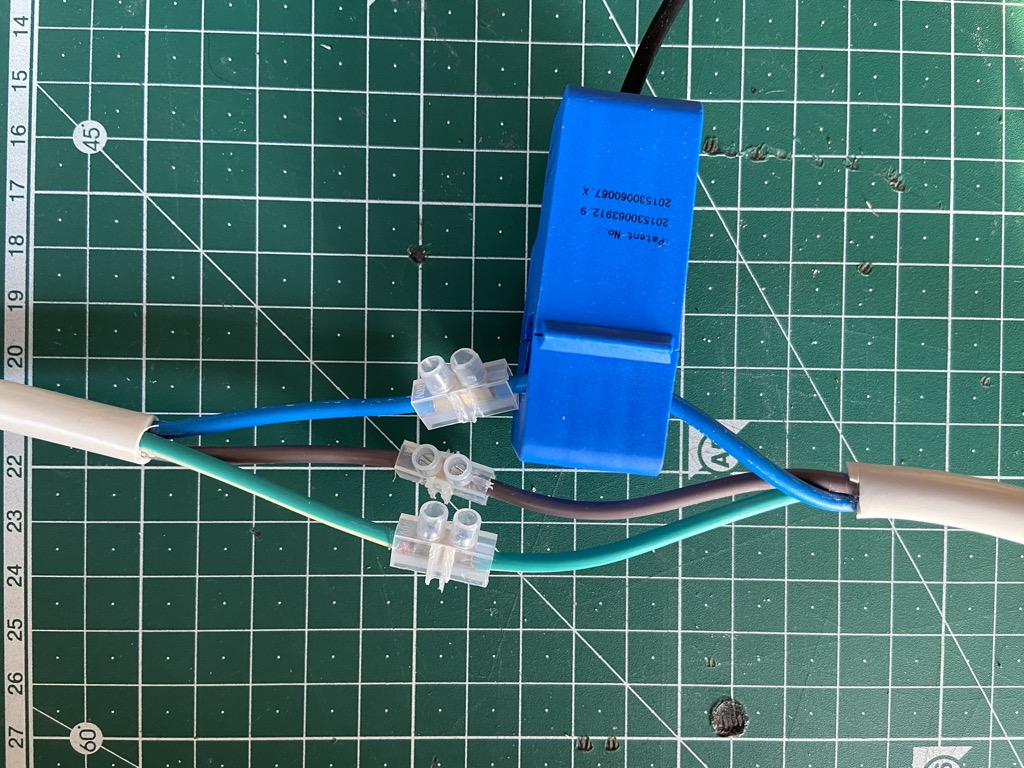
Example sensor - Open Engergy Monitor
![[bg]](/curious.bio/iot-backend/media/commit/383338fd6072ad7d3749bf33c474998cfd2d818b/docs/workshop/images/breadboard.png)
Example sensor - Open Engergy Monitor
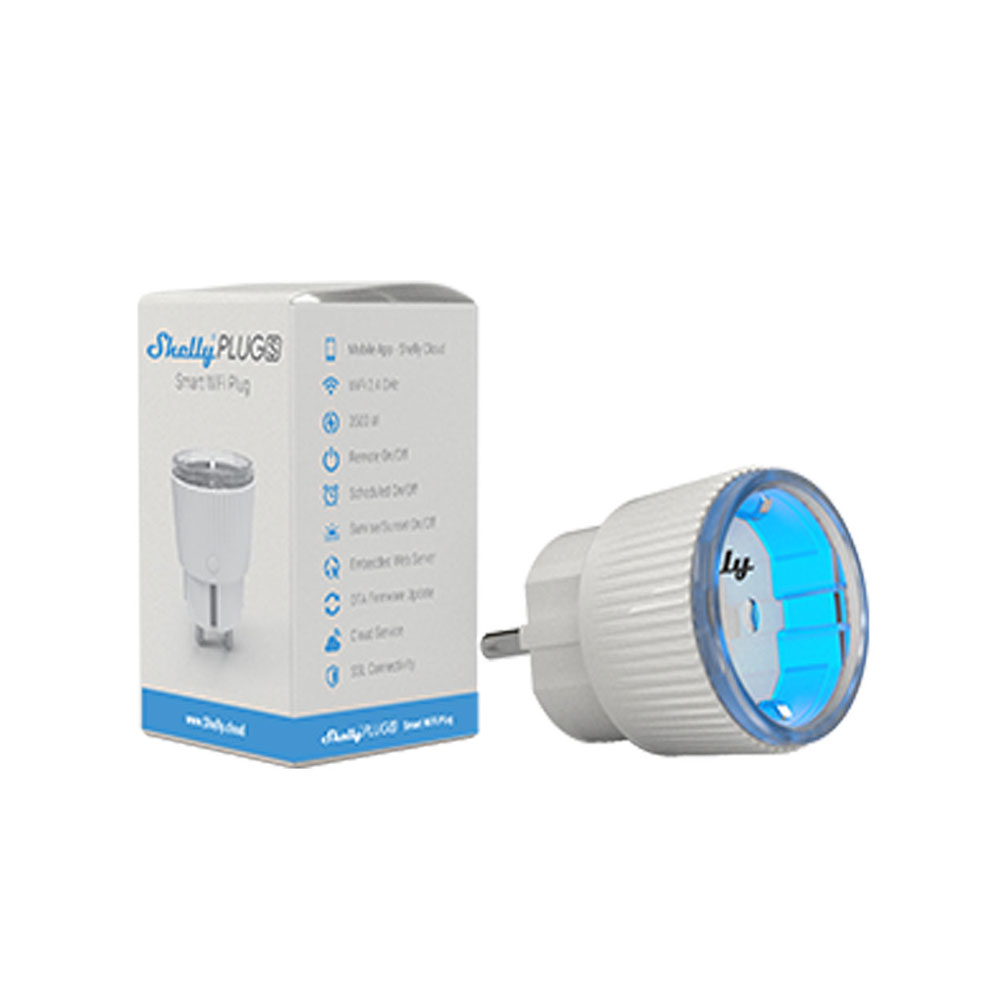
Example sensor - Shelly Plug
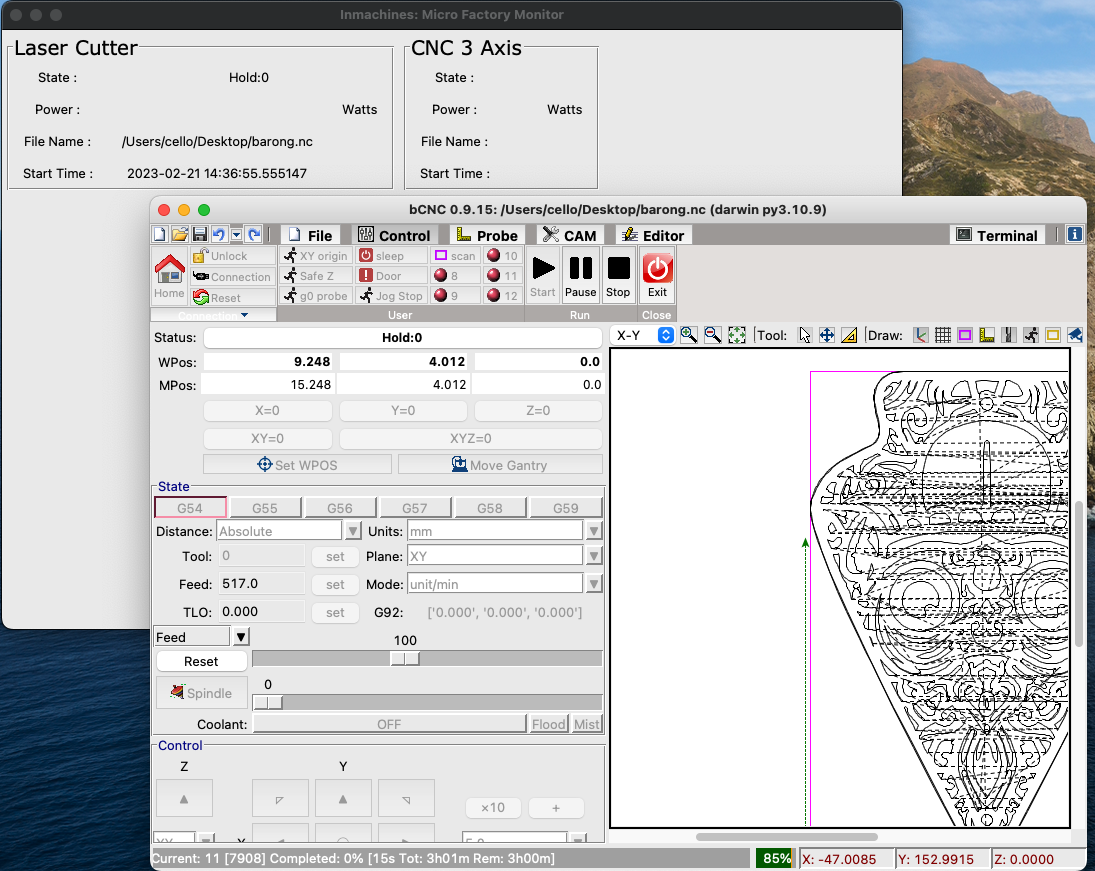
Example sensor - GCode Sender
MQTT (Message Queuing Telemetry Transport)
- publish-subscribe, machine to machine network protocol
- designed for connections with remote locations
- devices with resource constraints
- limited network bandwidth
- Internet of Things (IoT)
- runs on top of TCP/IP, QUIC (UDP) or Bluetooth
MQTT - Components
- one message broker (Mosquitto) and many clients
- broker receives published messages from clients
- routes them to subcribed clients
- clients subscribe to topic patterns

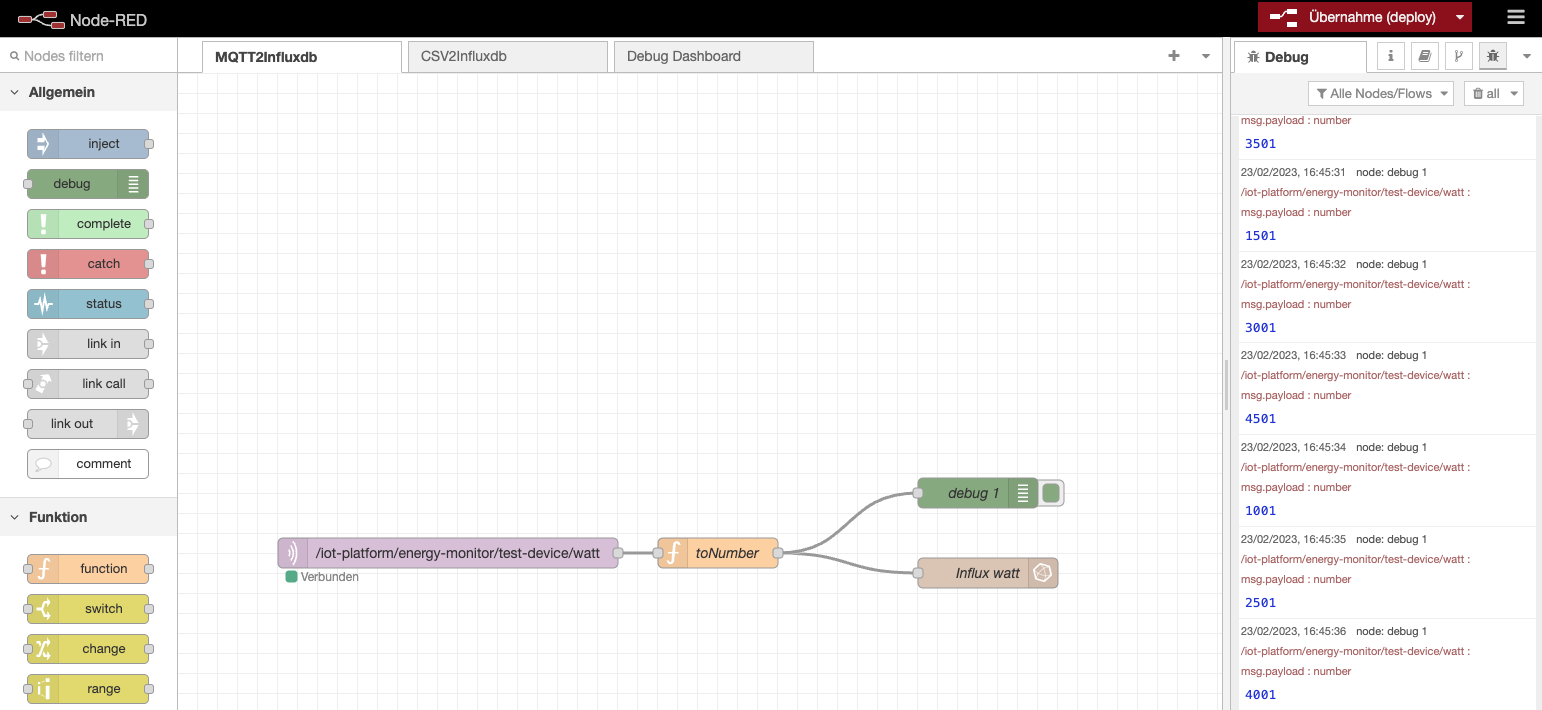
Flow - Node-RED
The idea behind it is to make it very easy to connect APIs, hardware devices, and anything else accessible over some type of network connection.
- open-source
- low-code
- visual programming tool
- flow-based development
Node-RED - Core Concepts
Nodes are the important part of Node-RED, they:
- are triggered by either receiving a message object from a previous node or an external event like an MQTT event
- process messages or events and then passes them on to the next node
A node can:
- Inject: Starts a flow by injecting a message or a payload.
- Change: Here you can do basic transformation or modification on the message object.
- Debug: Can be used to help developing flows by sending messages to the side bar.
- Switch: Here you can add logic (like sending the message to different nodes).
- Function: Add custom JavaScript for uses cases where simple nodes do not do the trick.
Node-RED - Plugins
Node-RED uses plugins:
- extend functionality (like dashboard)
- connectors (like influxdb)
- libraries (like aggregating watts and transform them to khw)
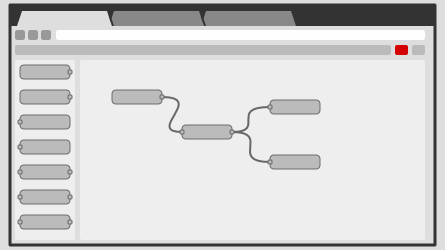
Node-RED - Simple Flow
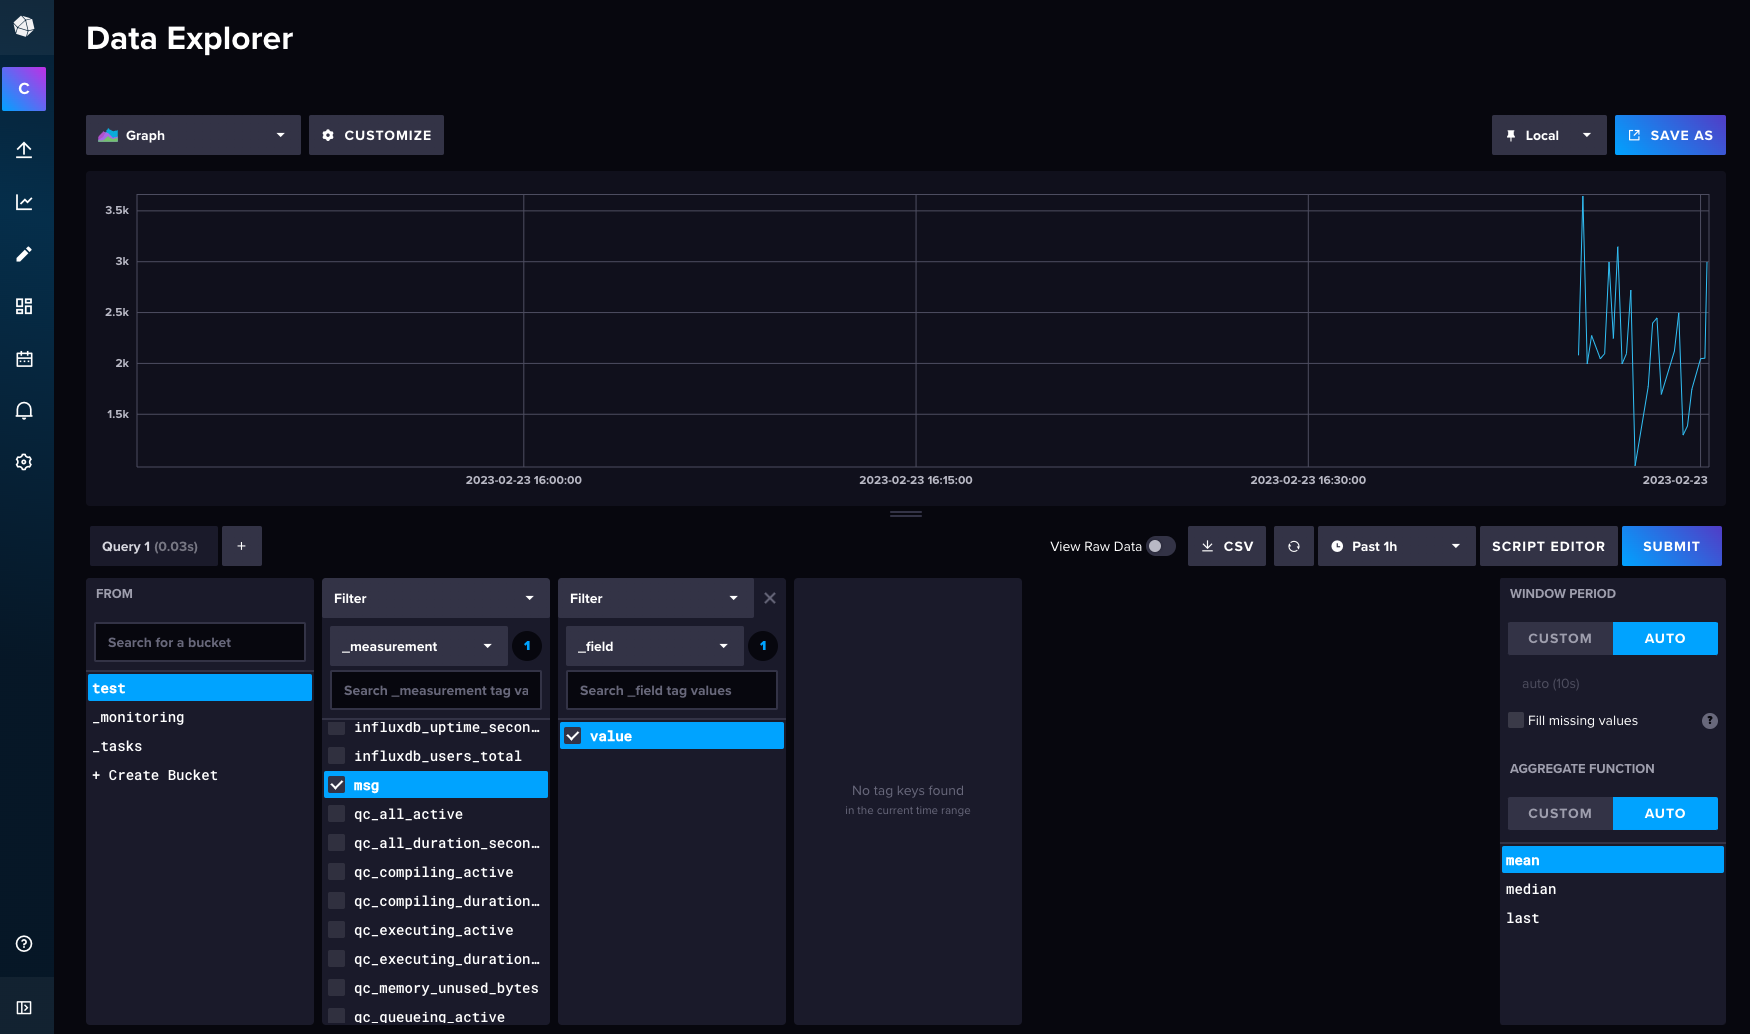
Database - InfluxDB
InfluxDB is a database for any time series data. Time series data is everywhere, since time is a constituent of everything that is observable. As our world gets increasingly instrumented, sensors and systems are constantly emitting a relentless stream of time series data. For example:
- Electrical activity in the brain
- Rainfall measurements
- Monthly subscribers
- Heartbeats per minute
- Electricity consumed by a chain saw
Database - InfluxDB
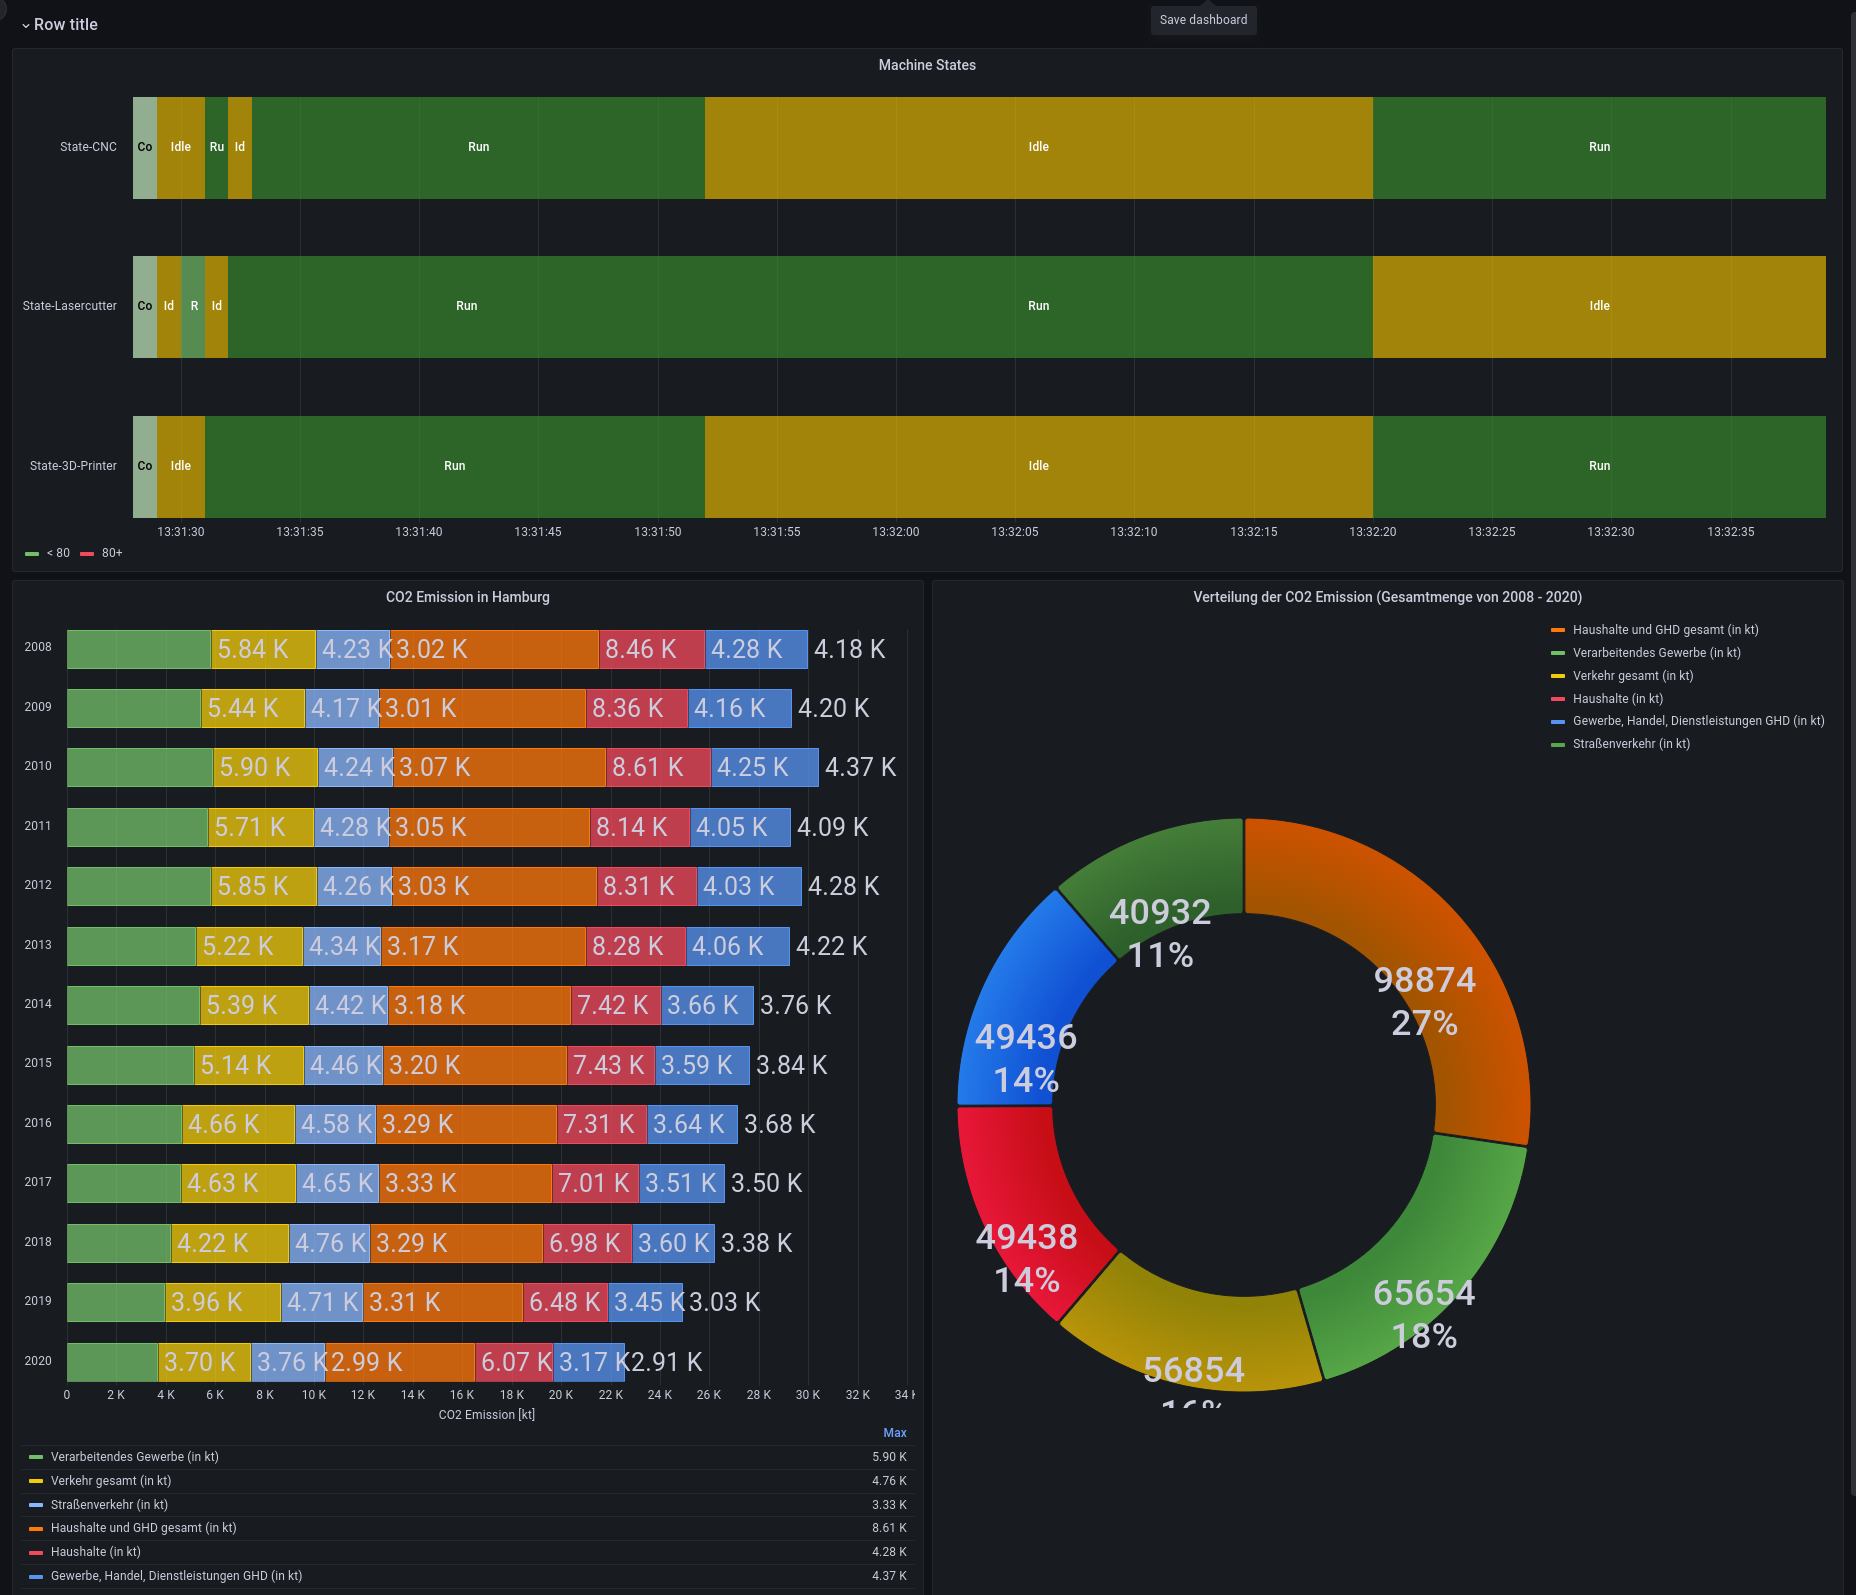
Dashboard - Grafana
Grafana is an open source analytics and interactive visualization tool.
- charts
- graphs
- alerts for the web when connected to supported data sources.
As a visualization tool, Grafana is a popular component in monitoring stacks, often used in combination with time series databases such as InfluxDB.
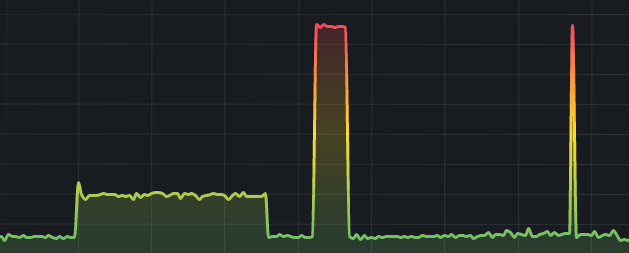
Dashboard - Example
Let's start
- Check installation requirements
- 64bit environment (AMD64, ARM64)
- Docker
- Docker-Compose
- Checkout the repository:
- Let's follow the README, together!
🫵 Hands on
Where can I find this presentation?
https://code.curious.bio/curious.bio/iot-backend/src/branch/main/docs/workshop
