3.6 KiB
Shelly Plug (S)
Shelly Plugs S are quite cheap but relatively accurate to measure power consumptions less than 2.5 kW.

Flash Tasmota
There's an OpenSource project to flash Tasmota on Shelly Plugs: mg2x
Locate your Shellie's IP adress (in my case: 192.168.2.150) and update it "over the air" with the Tasmota firmware:
http://192.168.2.150/ota?url=http://ota.tasmota.com/tasmota/shelly/mg2tasmota-ShellyPlugS.zip
Your Shelly will return a JSON object that looks like that:
{
  "status": "updating",
  "has_update": false,
  "new_version": "20230109-114426/v1.12.2-g32055ee",
  "old_version": "20230109-114426/v1.12.2-g32055ee"
}
After a while your Shelly Plug S should be flashed with Tasmota firmware.
Just be patient. This took longer than five minutes in my DSL connected network.
The Shelly Plus S will create create a new Wifi.
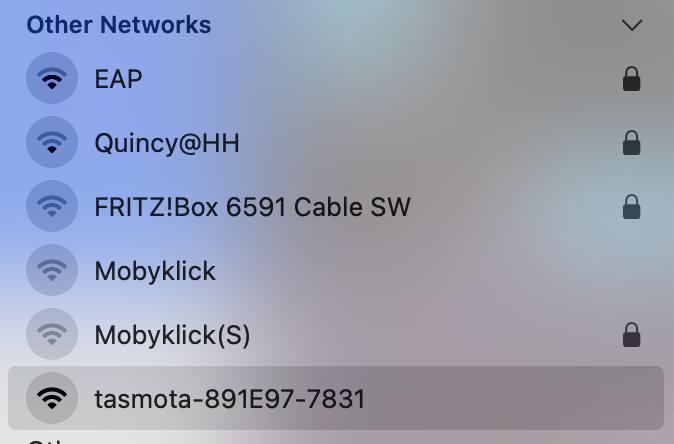
Join that Wifi and configure the device: http://192.164.4.1/
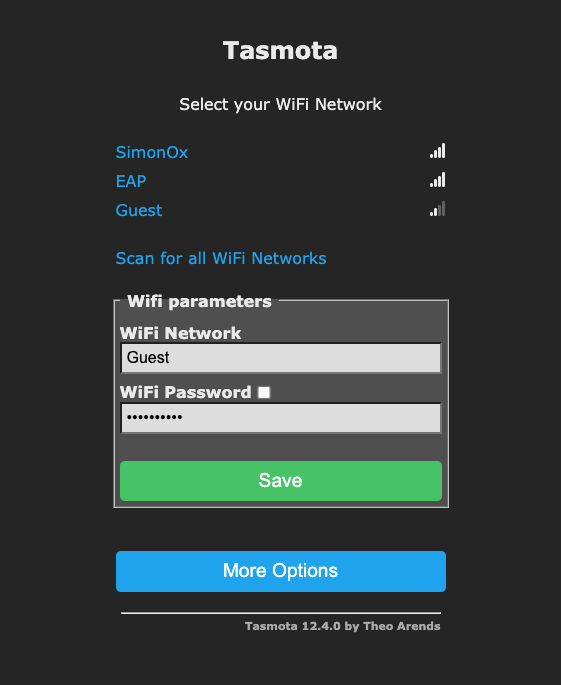
You can configure it as a BlitzWolf SHP product.
Then it offers you power measurement and a programmable toogle.
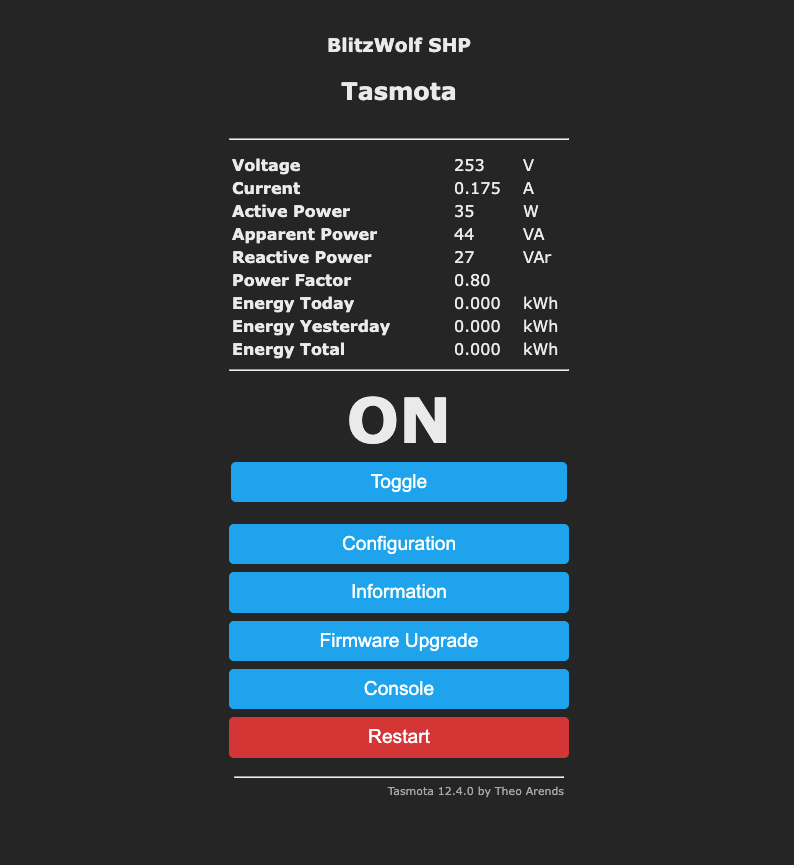
It should be configurable just like our plant monitor.
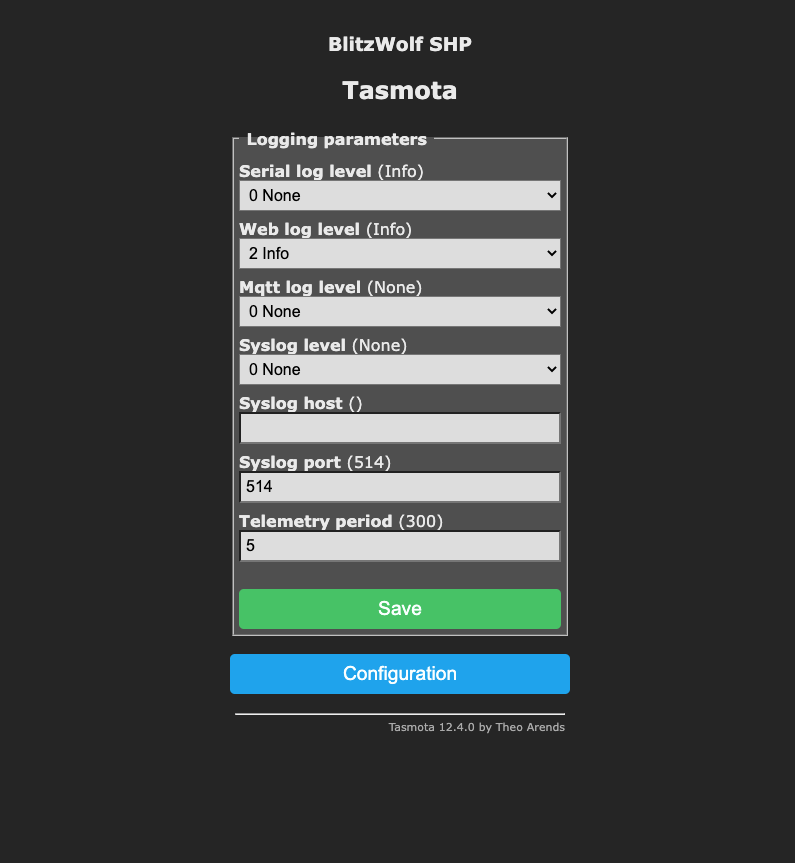
Just enable MQTT and enter a shorter telemetry period.
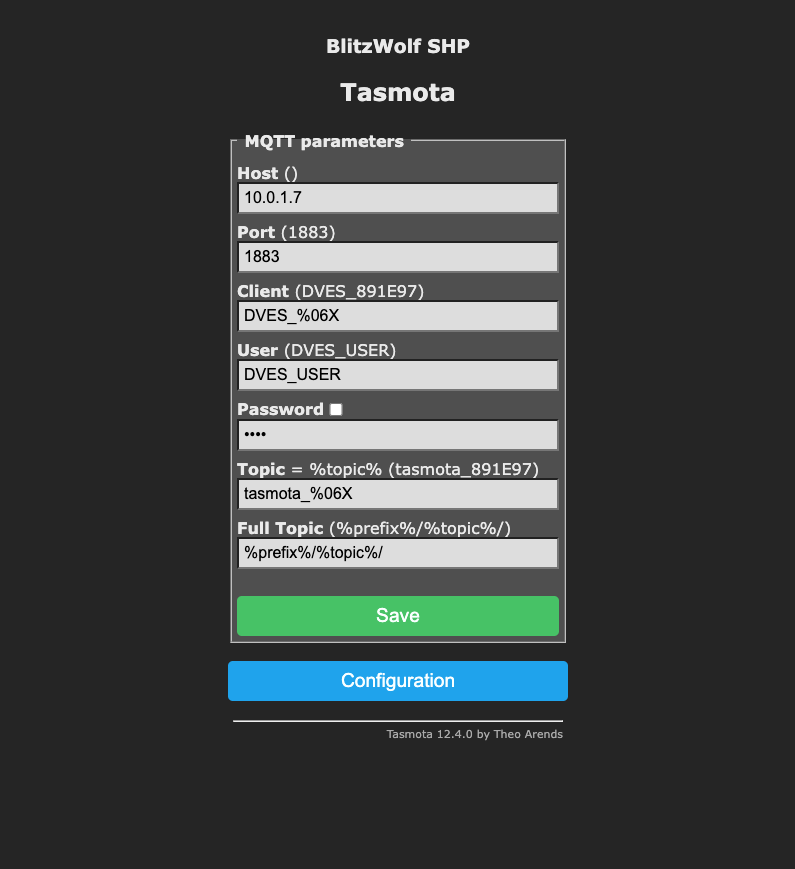
It will post MQTT messages unter a topic tele/tasmota_891E97/SENSOR like this one:
{
  "Time": "2023-02-27T16:45:07",
  "ENERGY": {
    "TotalStartTime": "2023-02-27T16:33:06",
    "Total": 0.004,
    "Yesterday": 0,
    "Today": 0.004,
    "Period": 0,
    "Power": 34,
    "ApparentPower": 44,
    "ReactivePower": 27,
    "Factor": 0.79,
    "Voltage": 253,
    "Current": 0.172
  }
}
We now can consume this messages in Node-RED, store them in InfluxDB and build a dashboard in Grafana.
InfluxDB Bucket
I created a bucket called shellyin InfluxDB, so we can store the messages in this bucket.
Node-RED
I create a usual flow in Node-RED. A MQTT node fetches the values.
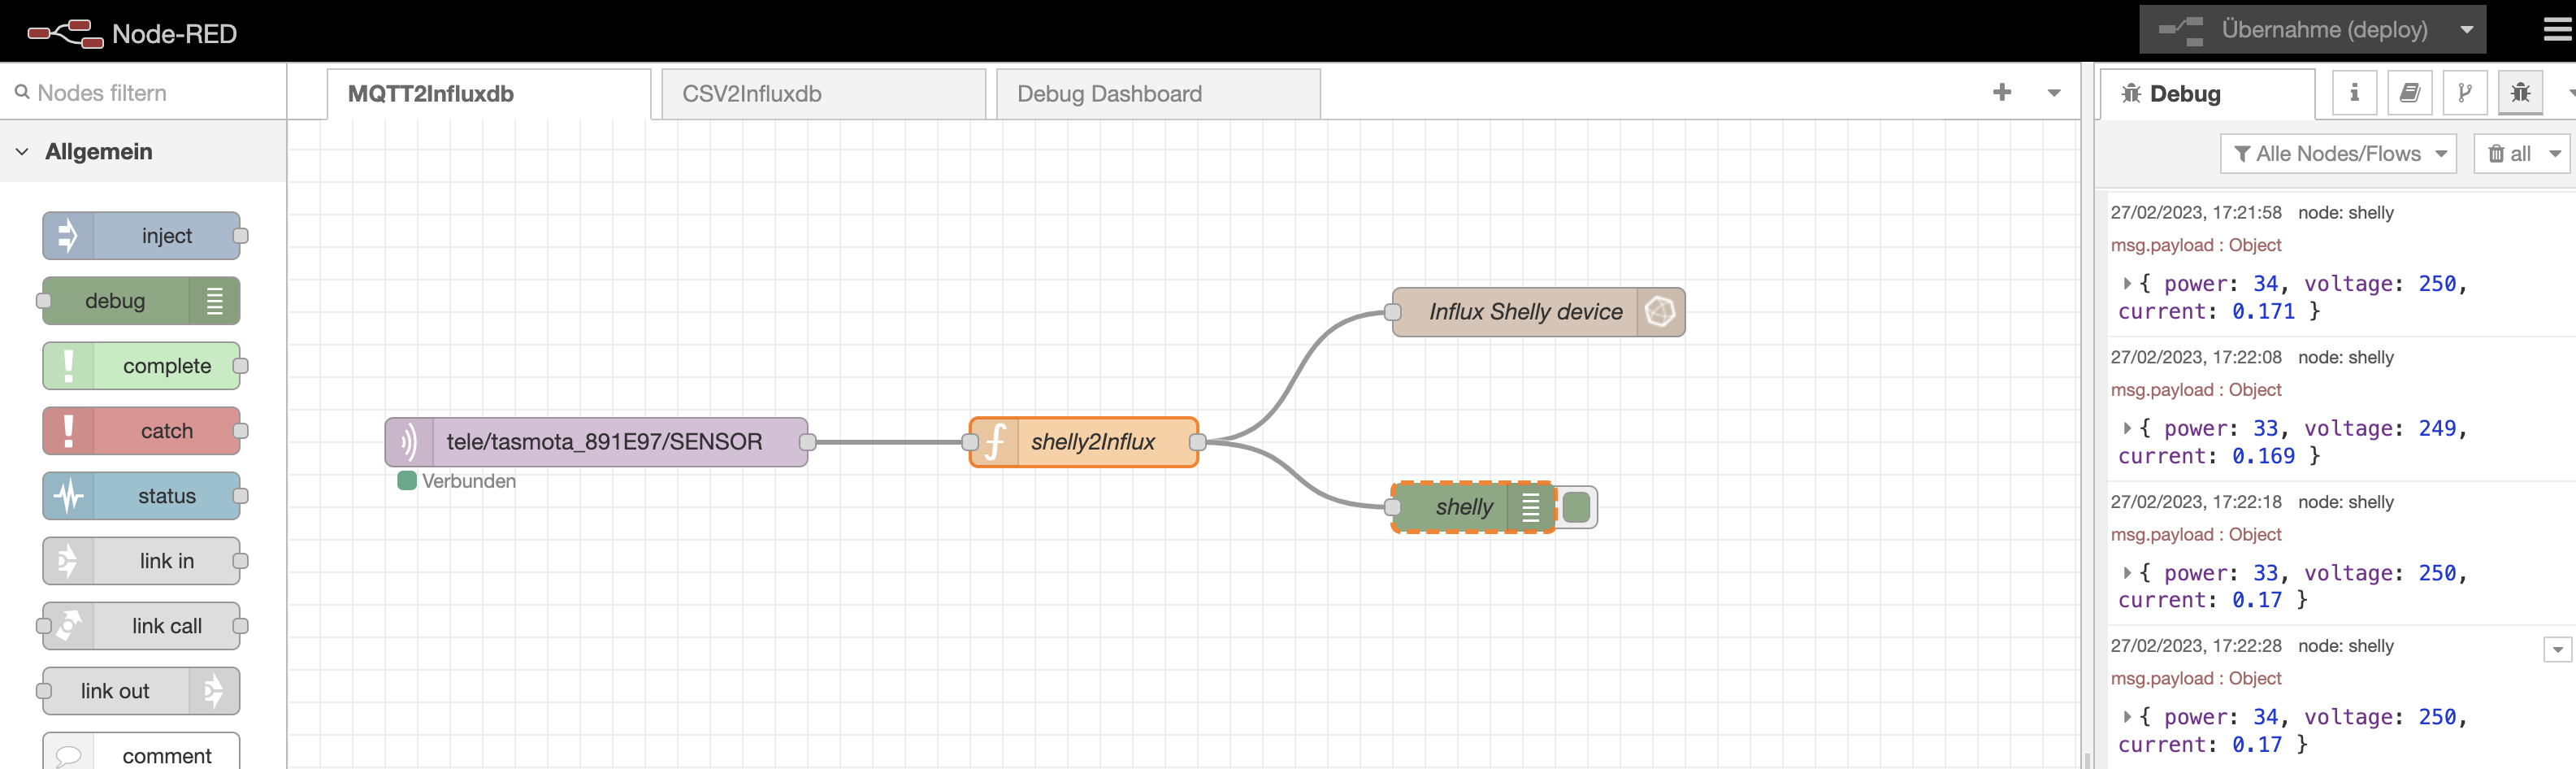
The message is fed into a filter function to only store usefull information:
return  {
    payload: {
        power: Number(msg.payload.ENERGY.Power),
        voltage: Number(msg.payload.ENERGY.Voltage),
        current: Number(msg.payload.ENERGY.Current)
    }
};
The payload will be stored in InfluxDB in the bucket "shelly".
InfluxDB Data Explorer
In Influx DB Data Explorer you can query the stored data.
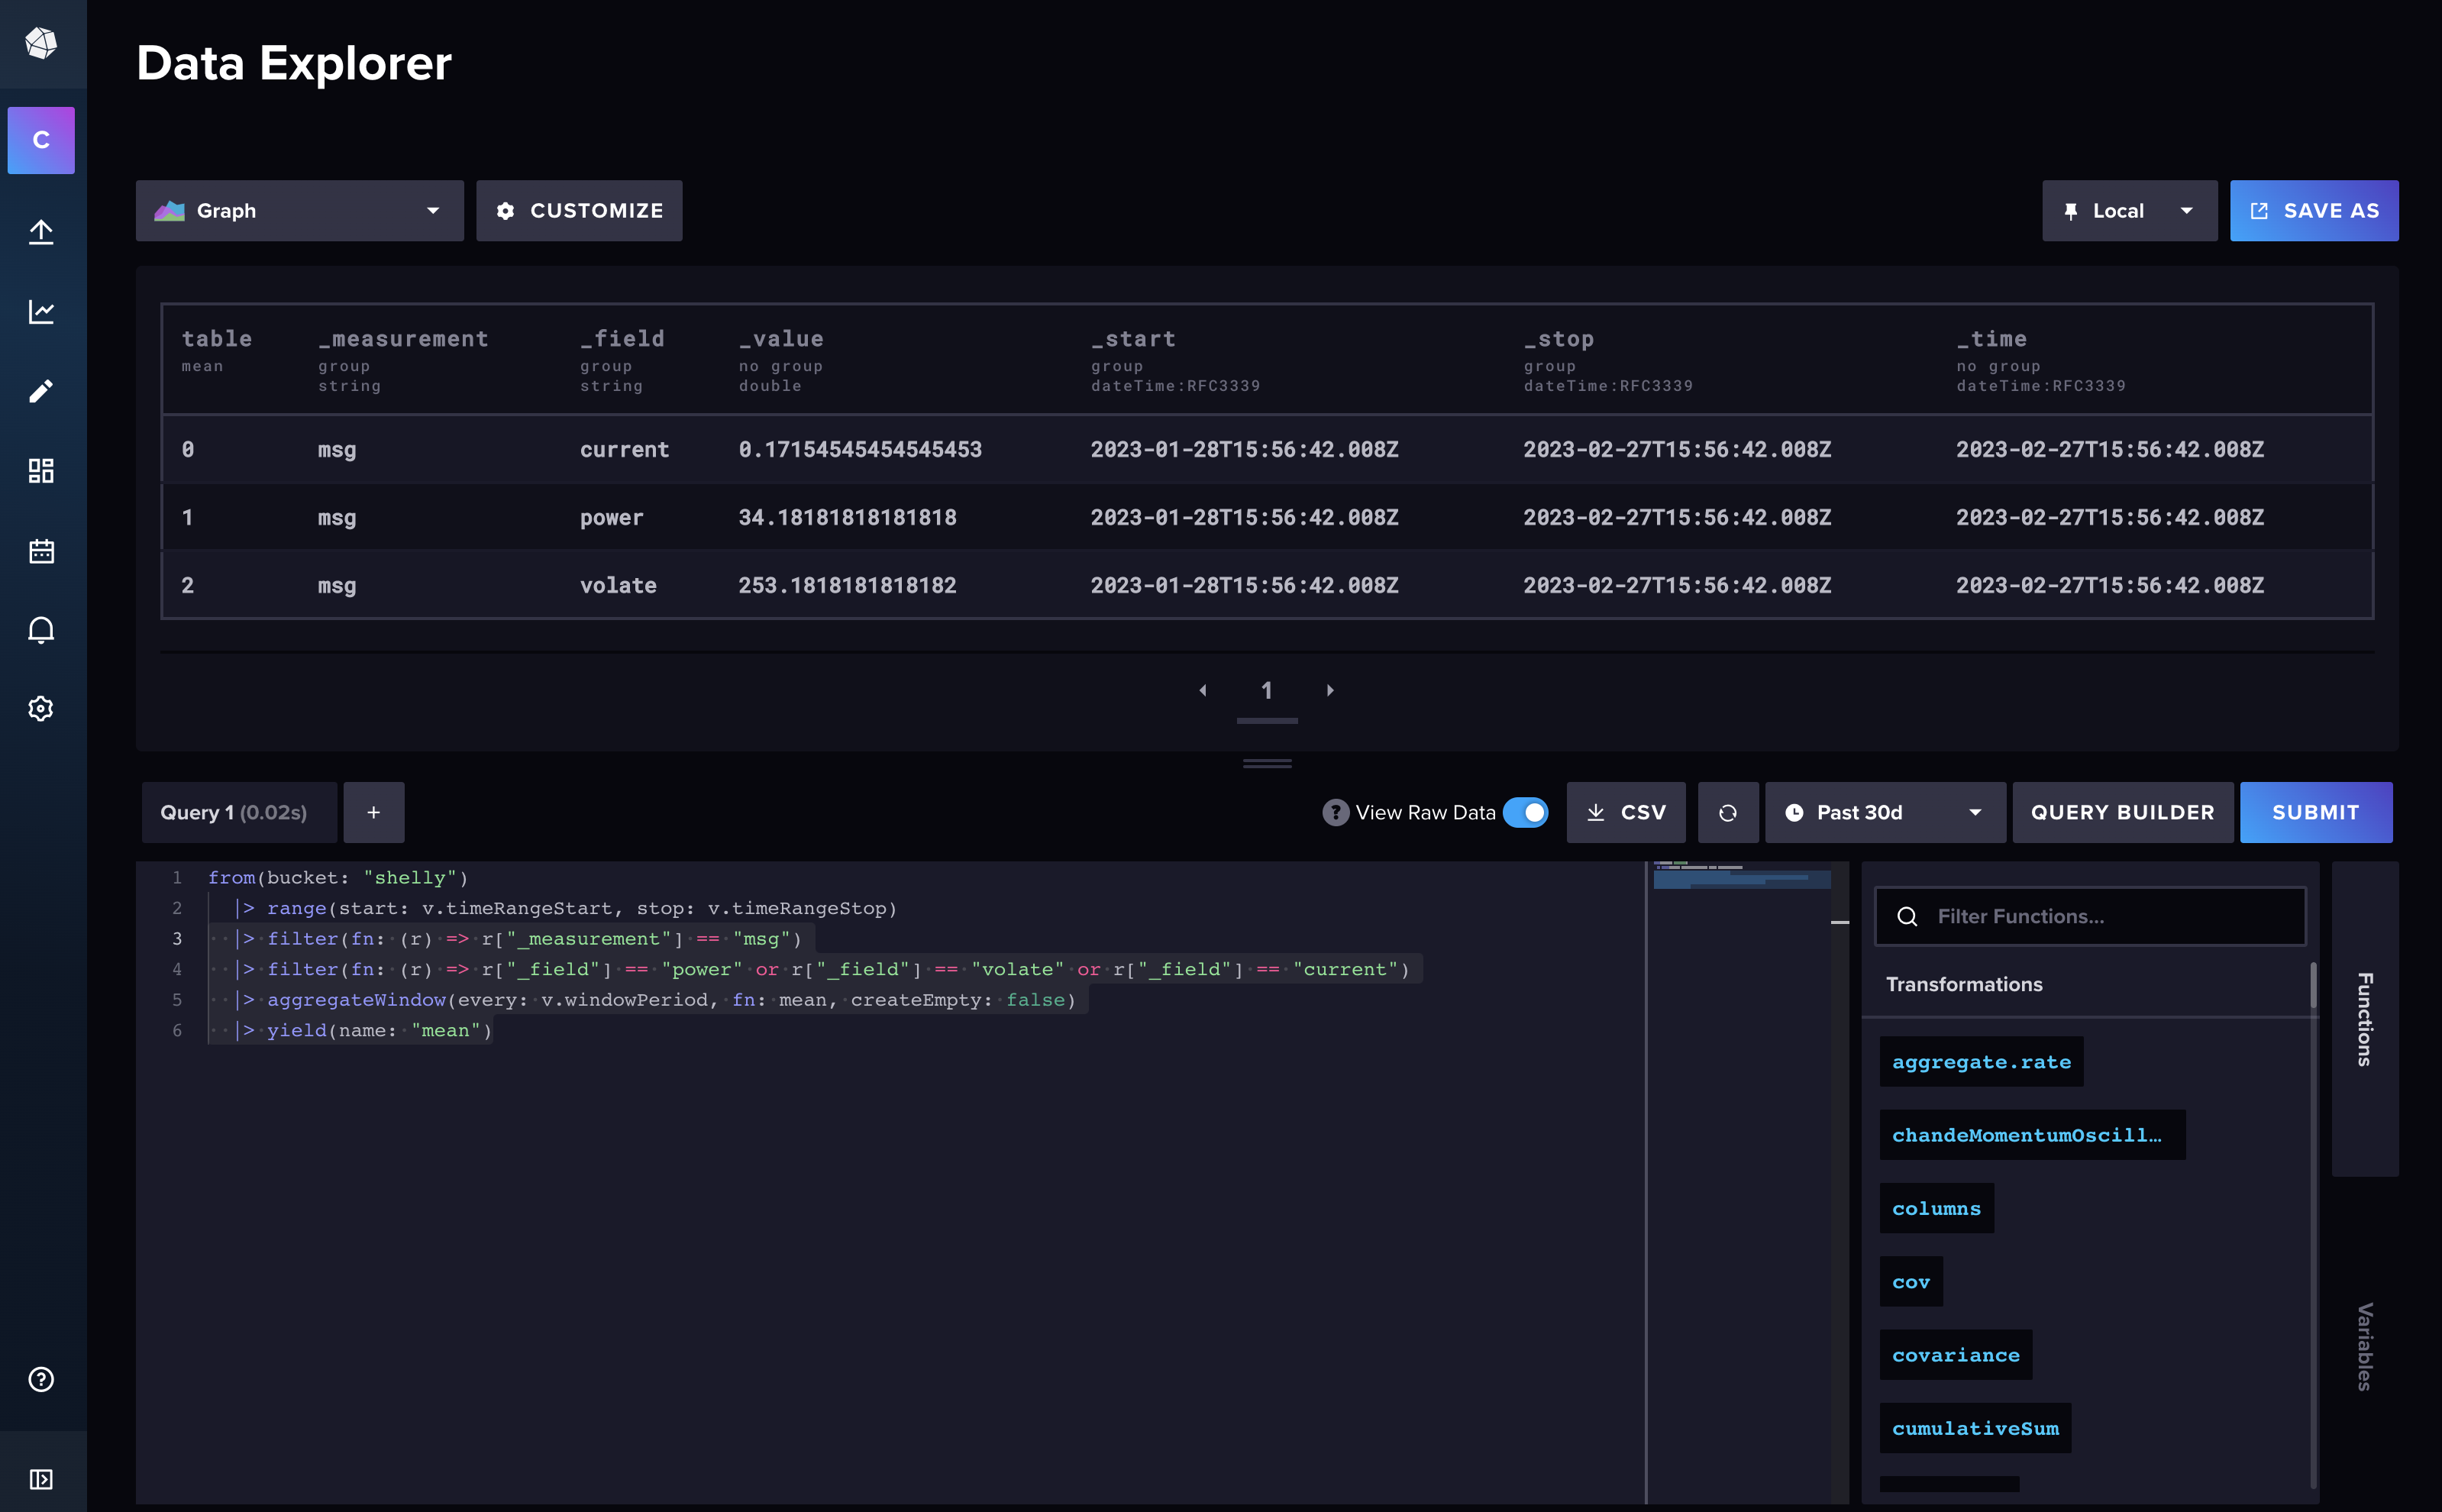
The query created by Data Explorer looks like that:
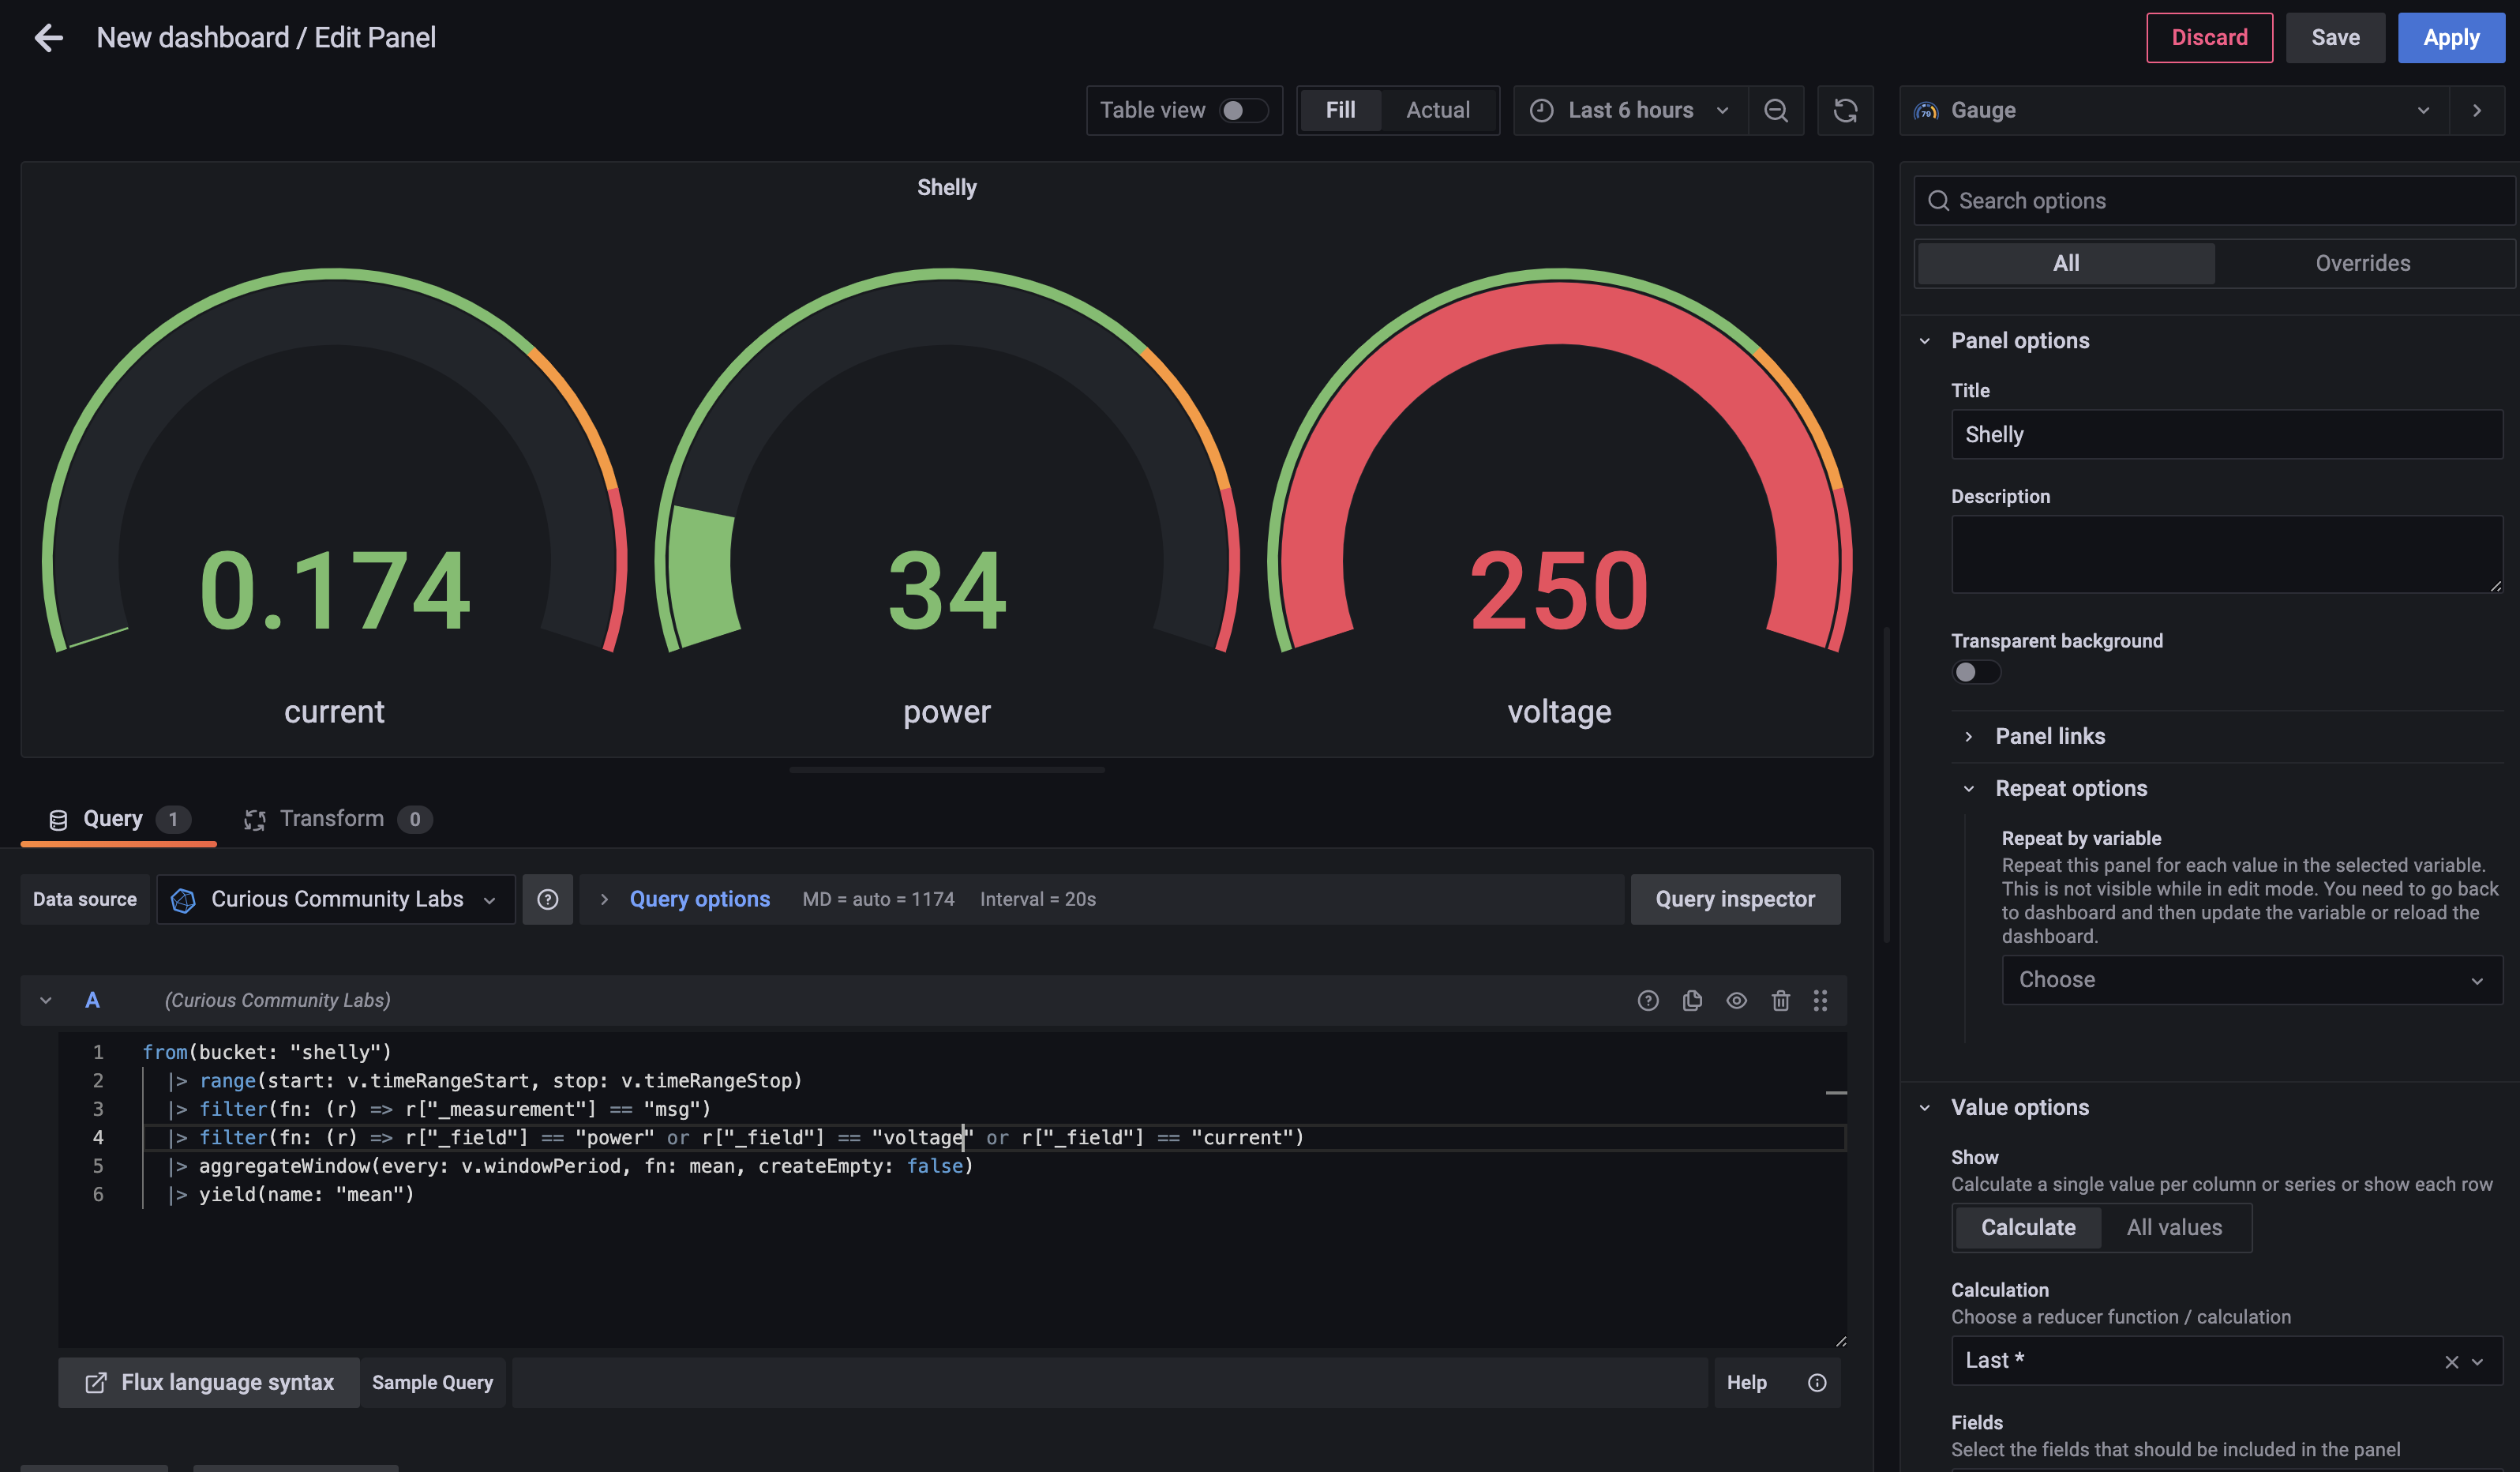
from(bucket: "shelly")
  |> range(start: v.timeRangeStart, stop: v.timeRangeStop)
  |> filter(fn: (r) => r["_measurement"] == "msg")
  |> filter(fn: (r) => r["_field"] == "power" or r["_field"] == "voltage" or r["_field"] == "current")
  |> aggregateWindow(every: v.windowPeriod, fn: mean, createEmpty: false)
  |> yield(name: "mean")
Grafana
Using this query you can crate a dashboard in Grafana.